Well, here we are in the middle of August, and the race is still in doubt.
But the race has gone on long enough, that there is a real shape and direction to it, as well as some interesting roadmarks.
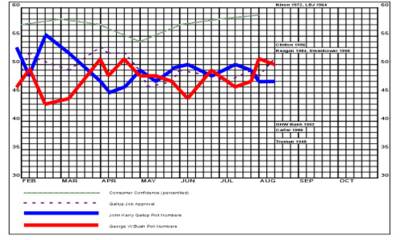
I apologize for the cluttered look of the graph above; I'm still trying to find a way to import a graph or chart into a blog, which will not become too busy to work. I have some very nice graphs charting a number of other races in several categories, which I couldn't use because the scale flat-out disappeared in a blog.
This chart has four lines to track. The blue line is how Gallup tracked Kerry's poll numbers since February, and the red line is President Bush. Note the back and forth between them. Note also, that neither has been below the mid-40s, nor much above 50%, except for a brief honeymoon for Kerry when he became the Democrats' front-runner. If you think I am unfairly discounting Kerry's high numbers, bear in mind that I did not go back to December 2003, when Saddam had just been caught, and Bush's poll numbers looked like NASA telemmetry.
The other two lines are what I consider relevant influences; the purple dotted line is Gallup's Job Approval, and the green line is Consumer Confidence Sentiment from the University of Michigan, which I converted to percentile form (based on CC numbers since 1978). These two factors are traditional indicators of the health or lack in a President's bid for re-election, and bear closer comparison to actual election results than any other factors I have been able to chart consistently in election campaigns.
If you look closely at the chart, you will observe that I have noted the mid-August positions of the eight previous incumbent Presidents. It's interesting to note, that the mid-August positions of Nixon and LBJ are literally off-the-chart compared to now; those races were obviously over by this point. But Clinton, Reagan, and Eisenhower were only a couple or three points better than President Bush is right now. Now, I know there are other polls which say otherwise, but the reason I use Gallup for this comparison, is that most of these other polls did not exist when Reagan was running, let alone Nixon, LBJ, or Eisenhower. Also, if you look at the low end, you will see that Carter, Ford and GHW Bush were running below 40% at this time. While Harry Truman was at 37% in mid-August and came back to win, the obvious lesson now, is that President Bush is running about 11 points better than his father was at this point, so it's only reasonable to say that Dubya is in much better shape.
Further, since Truman has come back from 37% at this point, but no one at 50% or better at this point in both Job Approval and Poll standing has ever failed to win re-election (and that threshhold really starts around 45% if you want to fairly draw the line between those who do win and those who don't), it's really reasonable to say that President Bush has a much better advantage than first glance may suggest.
My previous article on this subject detailed Gallup's accuracy in aggregate, so it's worth noting that Gallup has been off by as much as 12 points aggregate, but has often been tantalizingly close. Gallup has been within 3 aggregate points the last three elections, and seven of the last nine. Again, I acknowledge that other polls give Kerry the lead, some by as much as 7 points, but their track records are short, and the most substantial trends support the President, especially when the calendar of events between now and November are considered.

No comments:
Post a Comment